Voter Turnout: What’s Driving Participation Across Elections
Whenever an election rolls around, the big question isn’t just who will win, but how many people actually show up to vote. Voter turnout tells us how engaged citizens are, how confident they feel about the system, and what issues matter most. In this page you’ll find quick snapshots, easy explanations, and real‑world examples that help you make sense of the numbers.
Why Voter Turnout Matters
High turnout signals that a lot of people care about the outcome, so politicians can’t ignore any major group. Low turnout, on the other hand, often points to disillusionment, barriers to voting, or a belief that the race doesn’t matter for everyday life. That’s why media, analysts, and even campaign teams keep a close eye on turnout rates – they’re a barometer of democratic health.
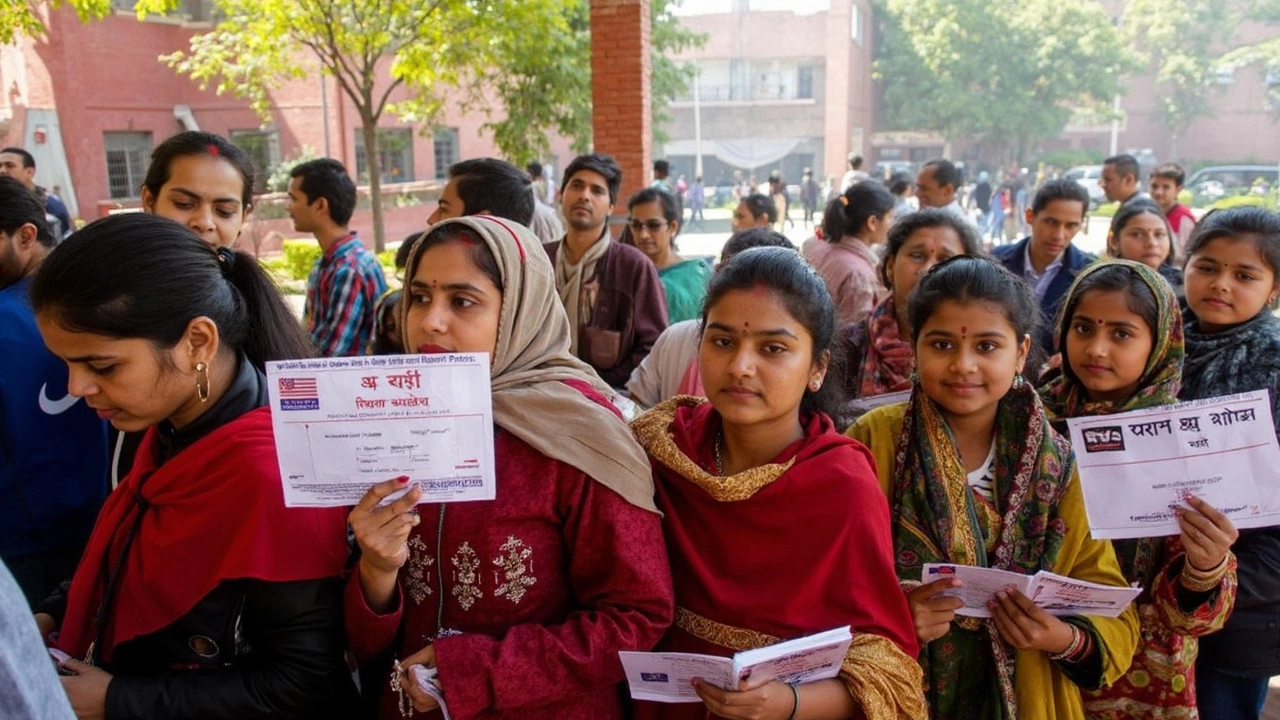
For instance, the 2019 Indian general election saw a turnout of 67%, a rise from the previous cycle. Analysts linked that jump to better voter‑ID roll‑out, more mobile polling stations, and a wave of youth enthusiasm after the 2014 elections. When you hear a figure like "67%", think of the thousands of stories behind each vote – from a student in Delhi using an app to check booth locations, to a farmer in Madhya Pradesh traveling two hours for a ballot.
Key Factors Shaping Turnout Today
Technology is a game‑changer. Apps that send reminders, digital voter‑ID cards, and live result trackers make the process smoother and more transparent. In regions where these tools are widely adopted, you’ll notice a bump in participation.
Weather still plays a surprising role. Heavy rain or extreme heat can keep people home, especially in rural areas without strong infrastructure. That’s why you’ll see spikes in turnout on clear days and dips during monsoon weeks in places like Uttar Pradesh or Bihar.
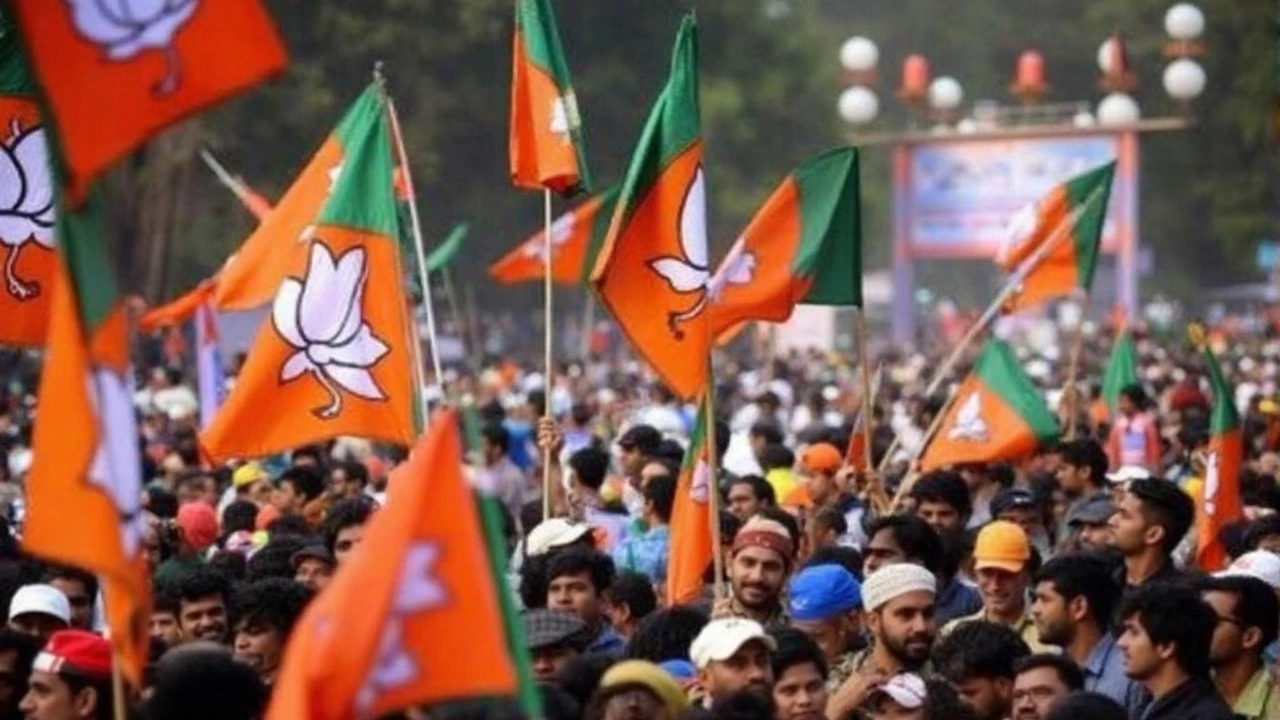
Campaign messaging matters too. When candidates focus on local issues – like water supply, job creation, or school funding – voters feel the stakes are personal. National headlines about foreign policy might not move a farmer in Chhattisgarh, but a promise to improve irrigation canals will.
Lastly, structural barriers such as long queues, lack of transport, or confusing polling‑station locations can deter even the most motivated voters. Many NGOs now run “voter‑help” volunteers who guide people to the right booth and explain the process, and those efforts often translate into higher turnout in the neighborhoods they serve.
Understanding these drivers helps you see why some states consistently hit 70% or more, while others struggle to reach 55%. It also shows where future improvements can make the biggest impact – like expanding mobile polling vans in remote districts or launching community‑based awareness drives.
Keep an eye on our tag page for fresh stories about voter turnout. Whether it’s a deep‑dive into a particular state’s results, a profile of a first‑time voter, or an analysis of how new legislation might change the voting landscape, we aim to keep the conversation clear and relevant.
Feeling inspired to learn more or get involved? Stay tuned, share your thoughts, and watch how the numbers change as more people decide to make their voice count.